Every organization needs monitoring to make sure that servers, networks, applications, cloud assets, and other elements work as they should. Monitoring also provides timely alerts, and it helps IT teams track down the causes of (potential) problems. Having a suitable monitoring tool will help you resolve problems faster, ideally before they have an impact on operational systems. Checkmk is an open source monitoring tool that is ideally suited for modern hybrid environments, combining enterprise-grade scalability and security with the extendibility of open source software.
In most cases, Checkmk runs on a dedicated server or virtual machine (VM). As I am just running a small monitoring setup for my home office environment, my host will be my computer with Ubuntu 18.04. The computer has four CPU cores and 4GB of RAM, which is more than enough to get started. Checkmk also runs on other Linux distributions, such as Debian, Red Hat Enterprise Linux, CentOS, or SUSE Linux Enterprise Server, and you can also run Checkmk on a Docker container or virtual appliance. If you install Checkmk on a dedicated host, the only additional steps you need are transferring the files to the server.
Checkmk can monitor anything with an IP address, including servers, cloud assets, and network devices, as well as systems that belong to the Internet of Things (IoT). For this article, I chose to monitor my TP-Link router. Checkmk also comes ready-equipped with reasonable thresholds for alerts. These pre-configured thresholds will come in handy, because your monitoring will be up and running within a few minutes without you having to worry about setting up alerts.
Choose a Checkmk Edition
You can use Checkmk for free. For this tutorial, I chose the Checkmk Raw Edition. You could also start with the Checkmk Free Edition, the free version of the Checkmk Enterprise Edition, which provides additional features. After 30 days, the Free Edition is limited to 25 hosts. The Checkmk Raw Edition is completely open source and permanently free.
Checkmk started as a front-end for the Nagios open source monitoring tool several years ago, but it became a stand-alone monitoring solution in 2012 and has replaced almost all Nagios components. The Checkmk Raw Edition still uses the Nagios monitoring core as a utility. To get started with Checkmk, go to the download section on the project website, where you will find the latest versions. Select the Checkmk Raw Edition, choose the latest stable version (this tutorial is based on version 2.0.0p13), and then choose your platform and your OS version. Click the download button and download the package.
Once the download has finished, you will need to install the package, including all of dependencies. Installation steps vary depending on your distro. In my case, I will switch to the terminal and go to my download folder, and then run apt install as root (see Figure 1):
apt install ./check-mk-raw-2.0.0p13_0.bionic_amd64.deb

Once the installation is completed, you can perform a test. The command omd should be accessible now. The following command:
omd version
should return the details of the Checkmk version you are currently using.
The omd command stands for Open Monitoring Distribution (OMD), an open source project created by Mathias Kettner, the founder of Checkmk. The OMD project includes monitoring solutions assembled from various components.
Create Your Checkmk Monitoring Site
The next step is to start an initial monitoring site (a site is also known as an instance). Make sure you are still root and use omd create to create a new Checkmk site and name it as you wish (Figure 2). This tutorial uses cmk_tutorial:
omd create cmk_tutorial

At the end of the output, you should now see the information about how to start and access your Checkmk site (Figure 3). You can follow the steps to change your admin password in the terminal, but I prefer to do that in the Checkmk user interface.

Copy the randomly generated password (you will need it in the next step), and start your monitoring site with omd start:
omd start cmk_tutorial
Should you want to drill deeper into Checkmk later on, it is important to understand what has just taken place. By creating a new Checkmk site, you have created a new user, which is known as the site user, and a group with the name of the site on your server. A directory for the site will have been created under /omd/sites, (e.g., /omd/sites/cmk_tutorial). Checkmk also copied its default configuration into the new directory, and a user with the name cmkadmin has been created for the Checkmk web interface.
Start Monitoring with Checkmk
Before you go to the Checkmk user interface, think about the systems you want to monitor. For this tutorial, I will monitor my TP-Link TD-W9960v router with the classic protocol Simple Network Monitoring Protocol (SNMP). If you also want to monitor systems with SNMP, you should make sure the SNMP agent is active on your device. In my case, I had to activate it in my router's web interface, and I decided to keep the SNMP community set to the default value public. (In a real-world setting, you will want to change this community string rather than using the default value.)
Once you are sure the host you want to monitor is ready to provide the monitoring data, it is time to switch to the Checkmk user interface in your browser. Every Checkmk site has its own URL, which consists of your monitoring server's IP address or host name and the name of the Checkmk site. In my example, this is 127.0.0.1/cmk_tutorial.
Open the link to your Checkmk site in your browser. You can open the link shown on your terminal. Log in with cmkadmin and the password you copied from the terminal. You will see an empty dashboard. Go to User in the sidebar on the left and, under Profile, click on Change password to change your password (recommended).
After that you can start adding hosts to your monitoring (Figure 4). In my case, I will add my router. Go to Setup | Hosts and click on Add host
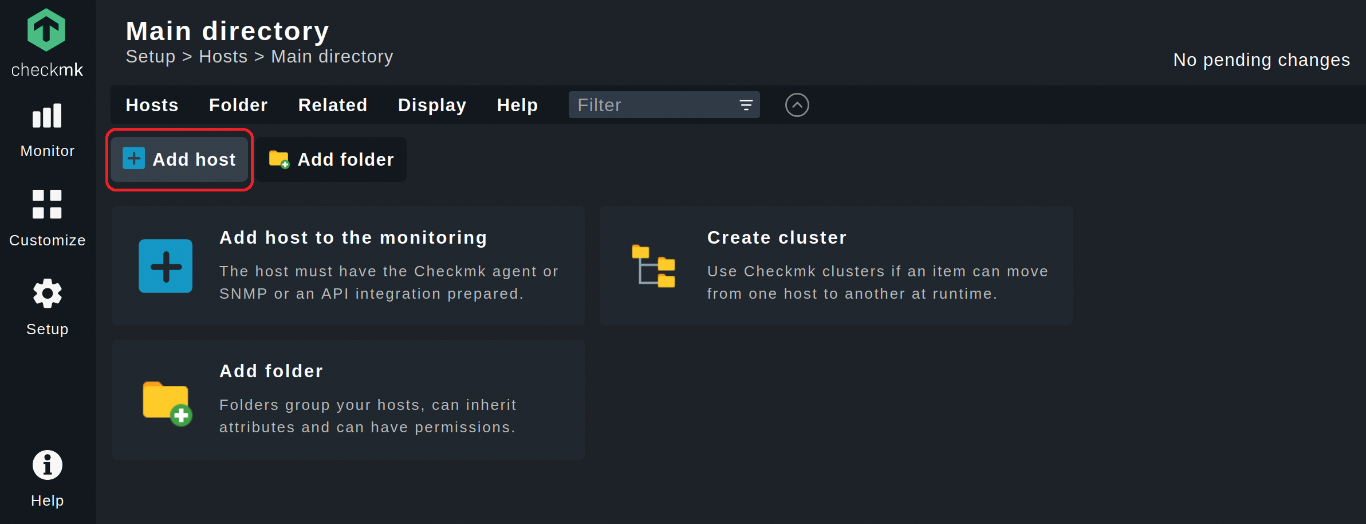
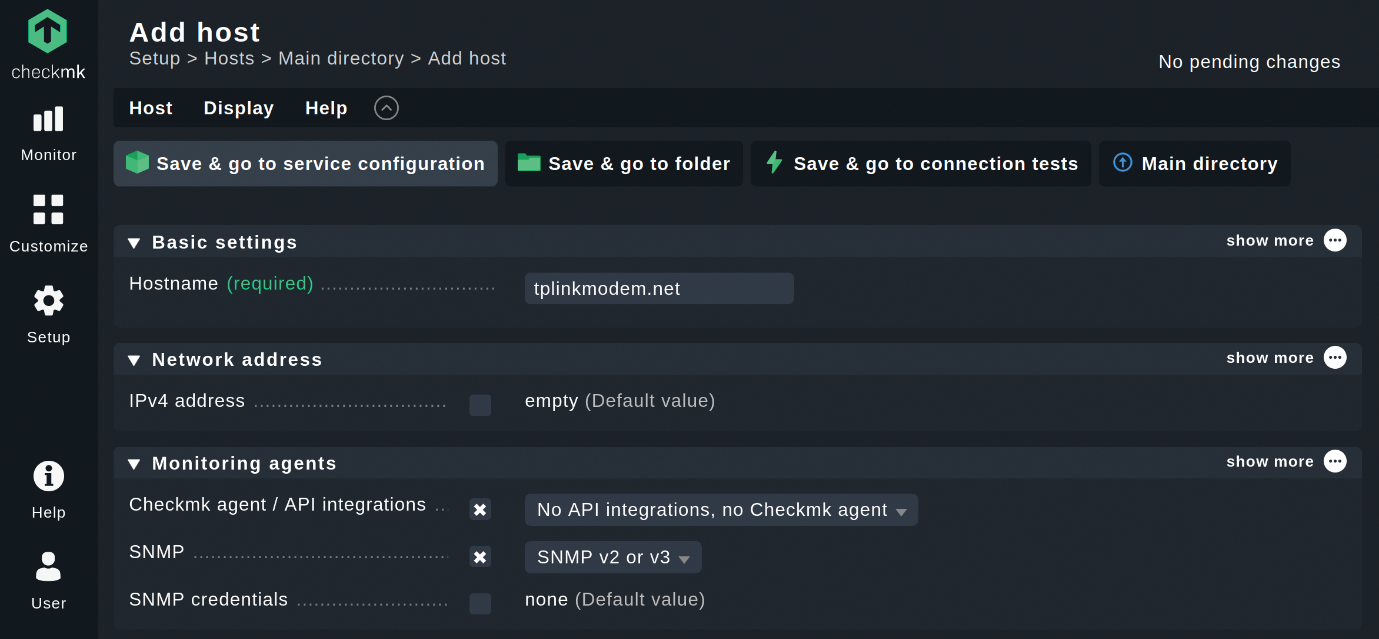
In my example, I only have to add the hostname tplinkmodem.net, because TP-Link set up the DNS for their devices and, thus, Checkmk can resolve the IP address for your hostname automatically. I recommend using this option, if available. If that is not the case, you will also need to add your device's IP address by activating the checkbox next to IPv4 address and entering the IP address.
For my router, I want to work with SNMP, but by default, Checkmk assumes that you use the Checkmk agents to monitor systems. The Checkmk agents are great for monitoring servers, but on most network devices, you cannot install additional software. Thus, go to Monitoring agents, check the box Checkmk agent/API integrations, and choose no agent.
Next, check the box labeled SNMP (Figure 5). Choose your SNMP version – SNMP v2 or v3 works in most cases. Because I did not change the SNMP community, I can leave the SNMP credentials box unchecked – by default, Checkmk assumes that the password is public. If that is not the case, you have to set the community string under SNMP credentials. Leave the other items unchanged.
Next, click on Save & go to service configuration. Checkmk will now automatically discover any relevant monitoring services on that host, and you should then see a list of Undecided services.
Click on Fix all to monitor all of these relevant services (Figure 6). That will add all of the detected services to the monitoring and will also remove services that have vanished. You can manage the services manually, of course, but the Fix all function makes it a lot easier.
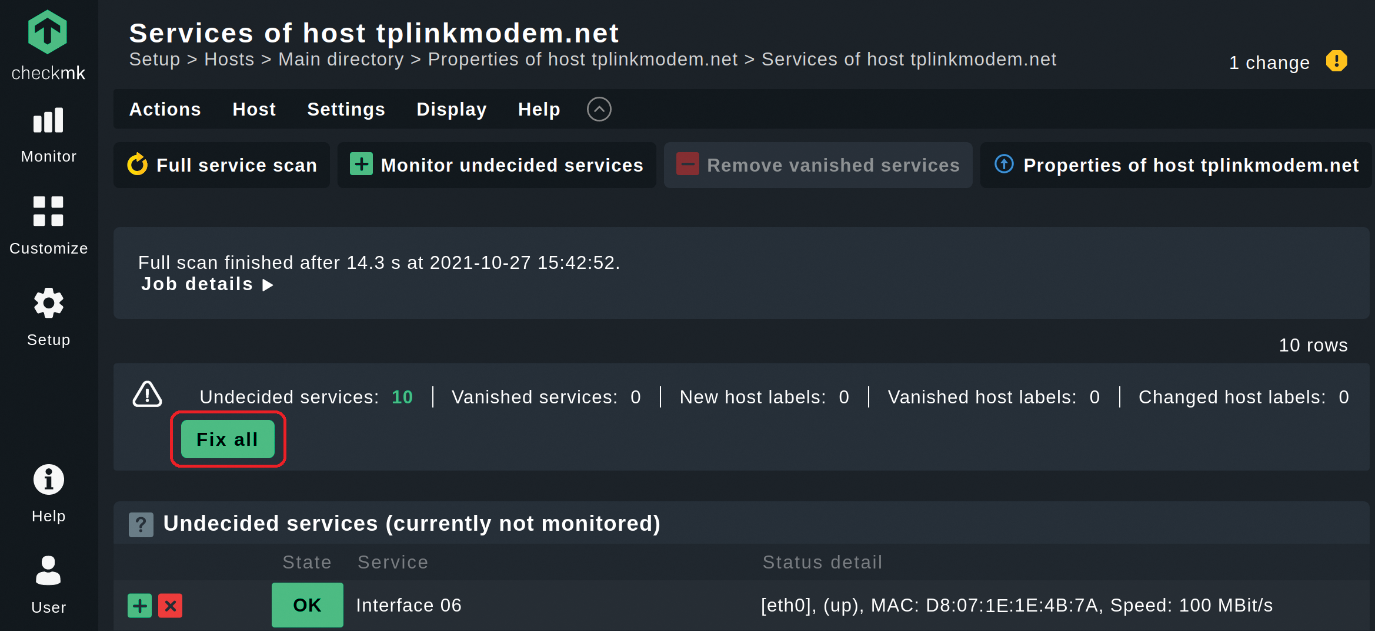
In this case, Checkmk simply detected all of my router's ports that are currently online, plus the uptime and the SNMP info check – 10 services in total for me. If there is an official check plugin available for your device, Checkmk will detect relevant information automatically. The 2,000 official check plugins cover the equipment from most common professional network vendors. This collection of plugins makes Checkmk a great tool for network monitoring and saves you a lot of time.
I recommend the blog post "Network Monitoring with
Activating Changes
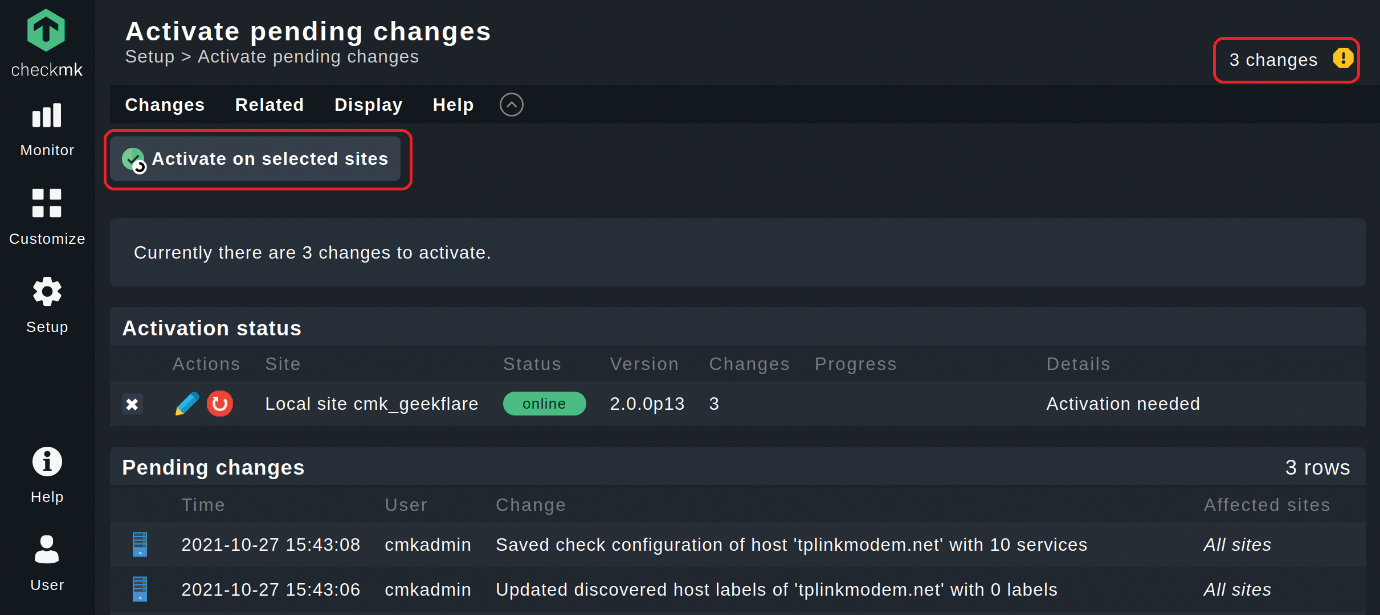
Finally, you need to activate the changes by clicking on the highlighted field with the yellow ! at the top right corner that counts the number of changes. After that, click on Activate on selected sites, and you will have successfully added the first host to your monitoring.
The activation of changes is a safety mechanism. All changes made will be listed under Pending changes (Figure 7). You can review any listed changes before they affect your monitoring. Checkmk differentiates between the Setup menu as a configuration environment, in which you manage the hosts, services and settings, and the Monitor menu, in which the actual operational monitoring takes place. New hosts and other changes in the configuration initially have no effect on the monitoring. You need to activate these before they can go into production.
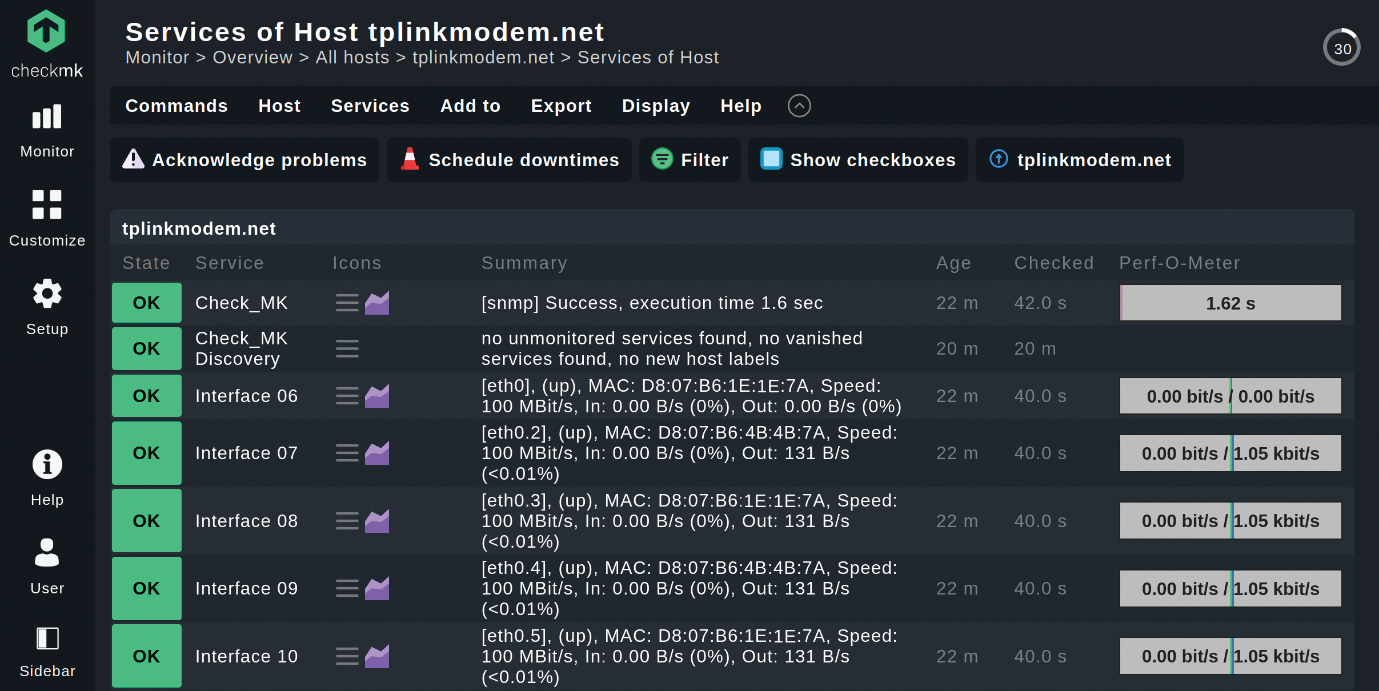
You find your host now under Monitor | Overview | All hosts. Click on a host, and you will see an overview of all the monitoring services of that host. Figure 8 shows the overview of my router. You can click on each service to see more details.
Conclusion
This article is intended as a proof of concept. I used the SNMP monitoring agent in the example because SNMP is supported on most home routers. However, be aware that there are some security concerns with SNMP. The US government Cybersecurity and Infrastructure Security Agency recommends that you only use SNMPv3 and has outlined additional precautions.
This tutorial ends here, but your real experience with monitoring has only just begun. If you want to continue, you should add your host server to the monitoring as well. Checkmk provides some lightweight, but powerful monitoring agents for server monitoring. You will find the agents for various operating systems, such as Windows and a number of Linux distributions, via the sidebar by clicking on Setup | Agents | Linux.
After you install, the procedure is similar: Add the host that you want to monitor, but you can leave the box Checkmk agent/API integrations unchecked and should not switch that to SNMP. By default, Checkmk assumes you are using Checkmk agents to monitor systems.
The Checkmk documentation, as well as in the official Checkmk forum, will provide answers for all your Checkmk questions.
This article originally appeared in Linux Magazine and is reprinted here with permission.
Want to read more? Check out the latest edition of Linux Magazine.


Comments